How to run a website performance test and choose what to fix first
Use PageSpeed Insights to check a public page, understand mobile and desktop results, and choose a useful first fix without chasing a score.
In this guide
Start with one important page, test it on mobile, and use the result to find one specific improvement. A speed score can point you in the right direction, but it cannot tell you how every visitor experiences your site.
Google’s free PageSpeed Insights gives you both a simulated page load and, when available, measurements from real visitors. You need a public website address and a browser. You do not need to install software or change your site to run the test.
Choose a page people actually use: your homepage, an article, a product page or a booking page. Different page types can have different problems. Do not submit private links, signed download URLs or addresses containing personal data.
Run the first mobile test
- Open PageSpeed Insights.
- Enter the full public address, including
https://and the page path. Use the published page, not an editor preview or a login screen. - Click Analyze and wait for the report.
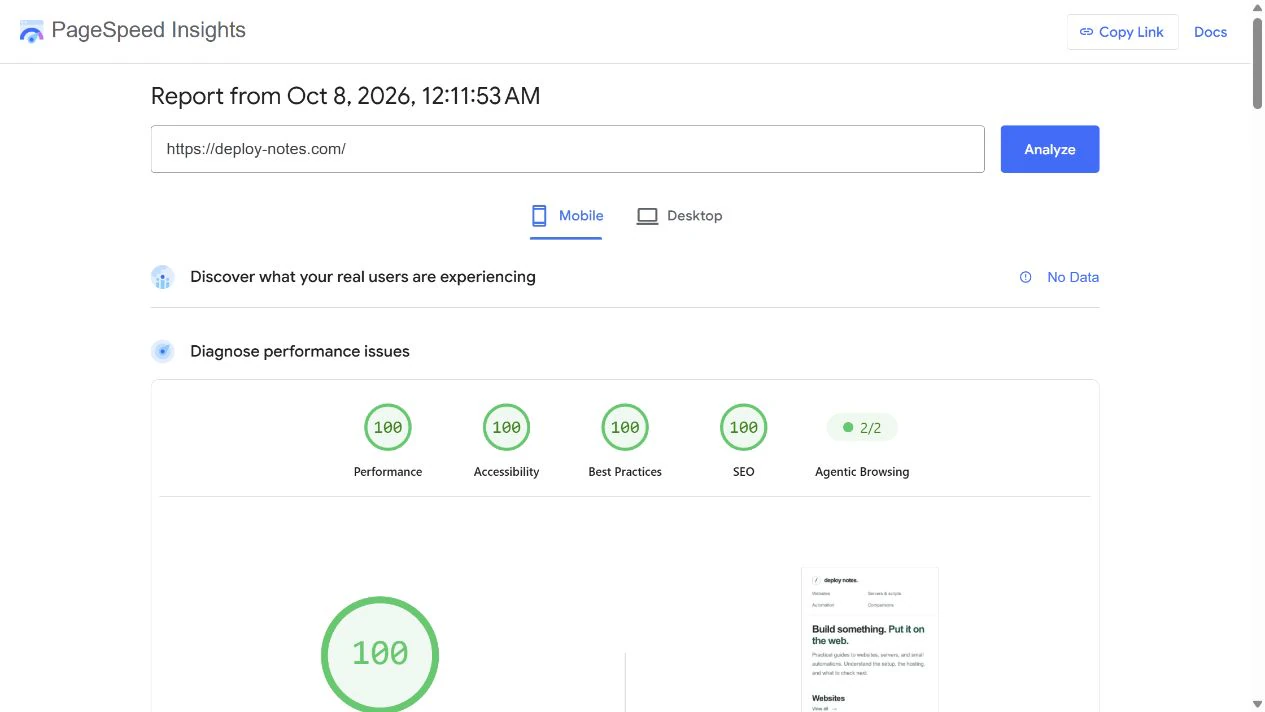
- Select Mobile. Keep the tested address in view so you know which page the results describe.
If the test cannot reach the page, first open that address in a private browser window. A login requirement, firewall challenge or unavailable page can prevent a useful test. Do not disable site protection blindly; check the error and your host’s access rules.
Separate real visitors from the simulated test
The report has two different jobs:
- Real-user data describes the previous 28 days of eligible Chrome visits. Check whether it covers This URL or the whole Origin—the website’s shared address. A site-wide result is not a measurement of this one article or product page.
- Lab data comes from Lighthouse, a tool that loads the page under simulated conditions. This is where the performance score and troubleshooting suggestions come from.
A new or lightly visited page may have no real-user data. That does not mean the site failed, or that nobody visited it. You can still use the lab report to investigate. Conversely, a good lab run does not establish that real visitors have a good experience.
After a change, lab results can update on your next run. The real-user report includes older visits until its rolling window moves on, so it is not an immediate before-and-after test.
Read the three visitor-facing questions
These are Google’s Core Web Vitals, a small set of measurements for loading, interaction and layout stability:
| Metric | Plain meaning | Google's good threshold |
|---|---|---|
| LCP: Largest Contentful Paint | When the main visible content appears | 2.5 seconds or less |
| INP: Interaction to Next Paint | How quickly the page visibly responds to an interaction | 200 milliseconds or less |
| CLS: Cumulative Layout Shift | How much visible content unexpectedly moves | 0.1 or less; this is a score, not seconds |
The field assessment uses the 75th percentile: a value at or below which 75% of the measured experiences fall. When all three have enough data, they must all meet their good thresholds to pass. PSI can also pass on good LCP and CLS when INP lacks enough data; that does not establish good interaction performance. This is more useful than treating a single fast load on your own laptop as the whole picture.
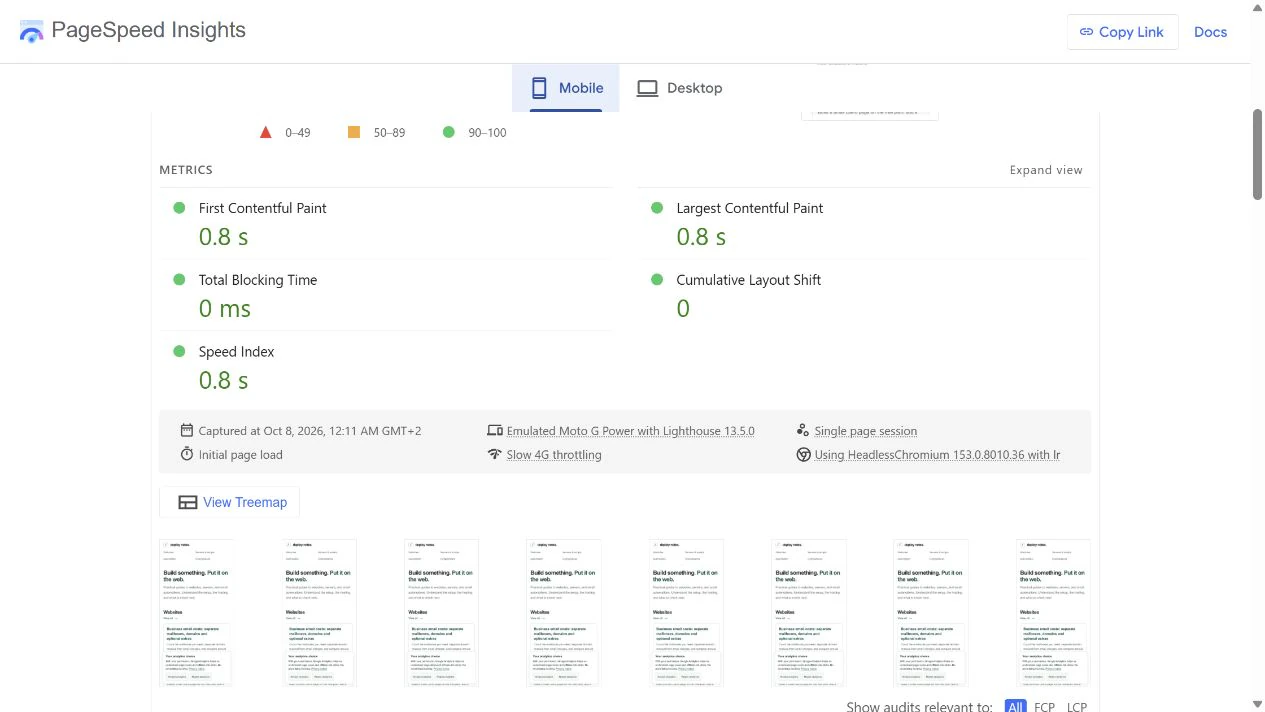
An ordinary Lighthouse load does not measure real-user INP. Its Total Blocking Time can help diagnose busy JavaScript during loading, but it is a different measurement. Do not rename it INP or use it to claim that interactions passed.
Choose one fix connected to an actual problem
Scroll to the lab diagnostics. Open a relevant item and look for the affected file, element or request. A suggestion becomes actionable when you can connect it to something on your page.
| What you see | First investigation | Avoid assuming |
|---|---|---|
| A large image is the LCP element | Check its file size, display dimensions and when it starts loading | That every image should be lazy-loaded |
| Text or buttons jump after loading | Look for images, embeds or banners without reserved space | That a higher hosting plan will stop layout shifts |
| Long JavaScript work blocks the page | Identify the responsible script or plugin before removing it | That deleting any script is safe |
| The initial server response is slow | Check the named request, caching and repeated results | That one run proves your host is the bottleneck |
For example, if a landing page loads an oversized hero image, start with that image rather than rebuilding the site. The LCP element is the large piece of content the measurement is watching. If it is an image visible immediately, delaying it with lazy loading can make the important content arrive later.
Keep the change narrow. Preserve the original file or setting so you can undo it, and check that the page still looks and works correctly. If a diagnostic requires code you cannot safely edit, give the report and affected item to your developer; a specific finding is more useful than “make the score green.”
Compare like with like
Record the tested URL, date, device tab, LCP and relevant diagnostic. Run the mobile test a few times before changing anything if the results vary. Then repeat the same page and device setting after one change. Compare the values and affected request, not just the score.
Select Desktop and repeat the check separately. Do not compare your old mobile score with a new desktop score: those runs use different conditions.
Small score changes can come from normal variation in the test environment. A consistently improved measurement plus a correctly working page is a better result than one unusually high score. A 100 score is not a promise of instant loading or a search ranking.
Your first test is complete when you have saved a report, identified its scope and chosen one evidence-based action—or established that no urgent issue appears. Test other important page types next. A fast homepage alone does not tell you how the checkout works.
Sources and useful links
- PageSpeed Insights — run a free test of a public page.
- Google’s explanation of PageSpeed data — lab conditions, the 28-day window and URL versus origin data.
- Web Vitals — the meaning and thresholds of LCP, INP and CLS.
- Lighthouse performance scoring — why scores vary and how to interpret them.